pharmhand creates clinical study tables and reports from ADaM datasets. It uses S7 classes to structure clinical data and outputs formatted tables and plots for Word documents.
Installation
# install.packages("pak")
pak::pak("sims1253/pharmhand")
Optional: Bayesian meta-analysis features require a Stan backend.
install.packages(
  "cmdstanr",
  repos = c("https://mc-stan.org/r-packages/", getOption("repos"))
)
cmdstanr::install_cmdstan()
install.packages("brms")
Quick Start
Generate complete reports in a single call:
library(pharmhand)

# One-line demographics report
quick_demographics_report(adsl, "demographics.docx")

# One-line safety report with multiple tables
quick_safety_report(adae, adsl, "safety.docx")
Examples
Demographics Table
# Simple: pass data.frame directly (auto-coerced)
demo_table <- create_demographics_table(adsl)
demo_table@flextable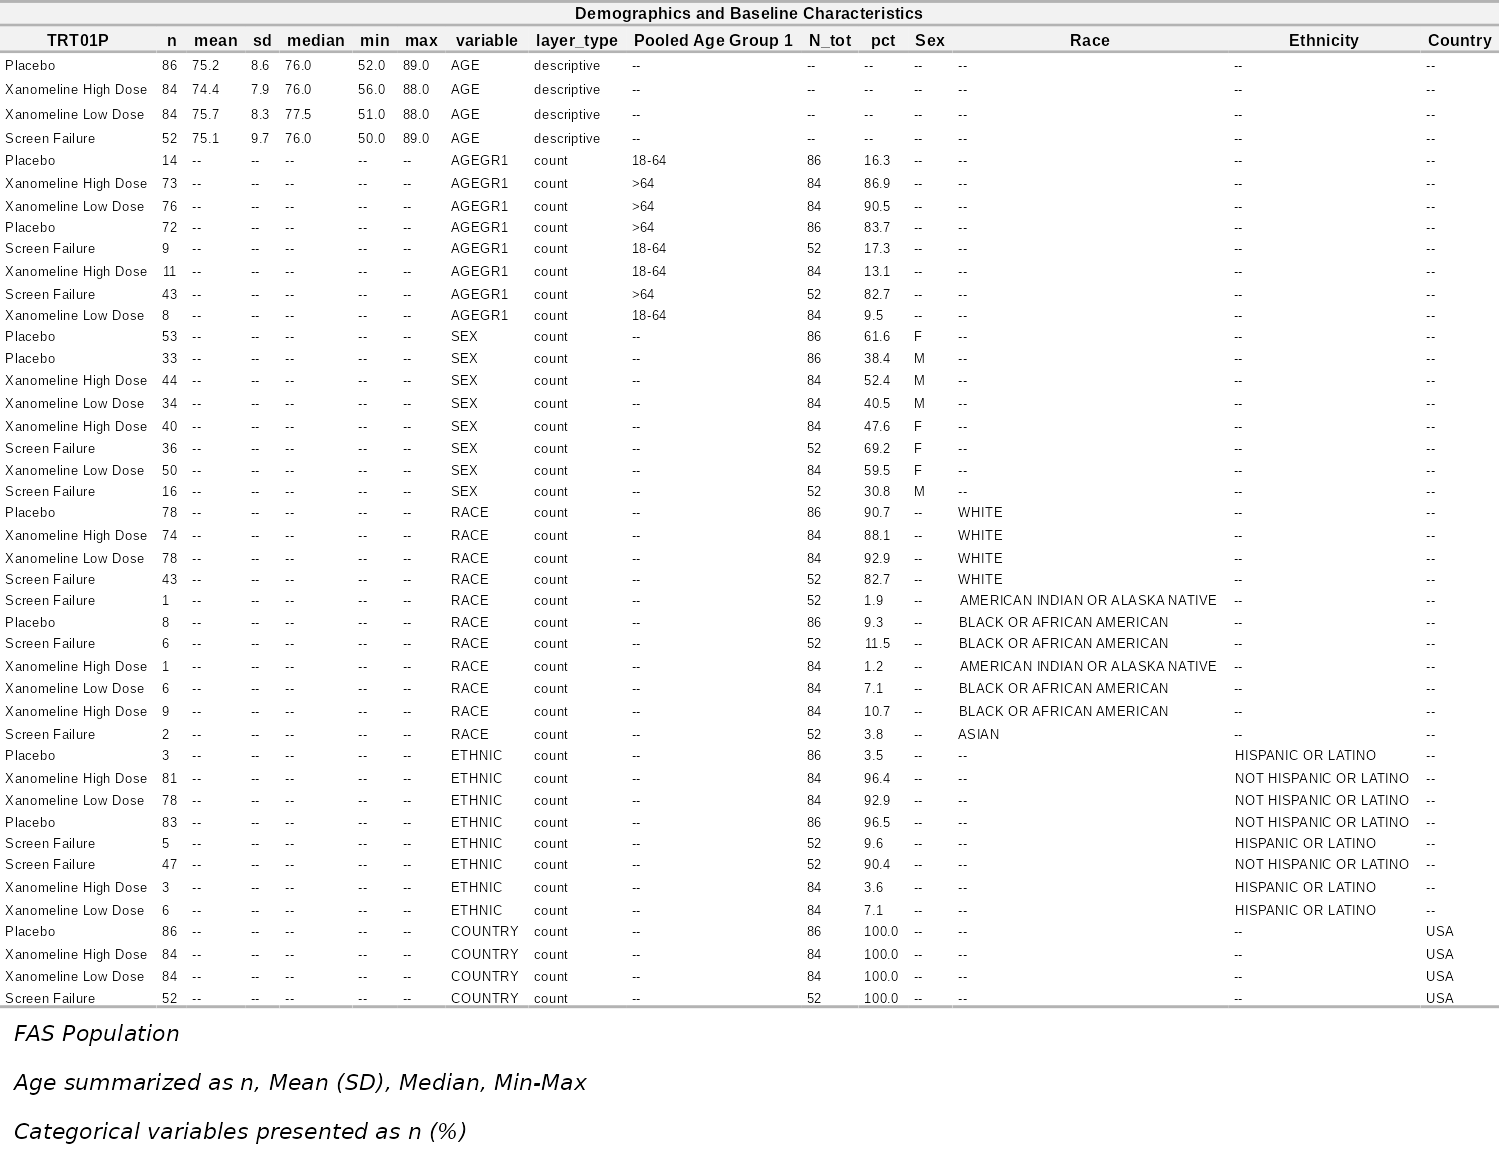
For advanced use with population filtering:
# Advanced: explicit ADaMData for population control
adam_data <- ADaMData(data = adsl, population = "SAF", trt_var = "TRT01P")
demo_table <- create_demographics_table(adam_data)
Kaplan-Meier Plot
km <- create_km_plot(
  data = adtte,
  time_var = "AVAL",
  event_var = "CNSR",
  trt_var = "ARM",
  title = "Kaplan-Meier Plot: Overall Survival",
  risk_table = TRUE,
  show_median = TRUE
)
km@plot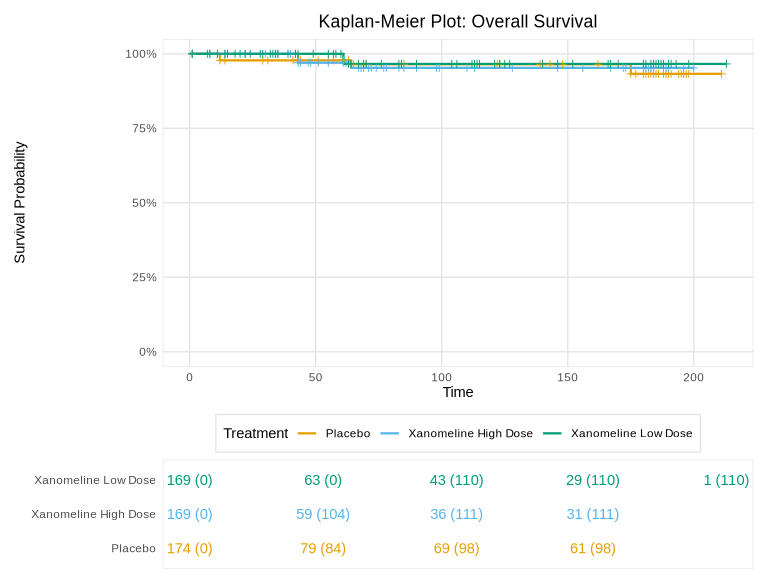
Configuration
Customize defaults package-wide:
# Set your study's preferences once
options(
  pharmhand.trt_var = "ARM",         # Treatment variable
  pharmhand.autofit = TRUE,          # Auto-fit table columns
  pharmhand.conf_level = 0.95        # Confidence level
)

# All functions now use your preferences
create_demographics_table(adsl)  # Uses ARM instead of TRT01P
Validation
Scalar validation helpers reject NA values. Use assert_no_na() for explicit NA checking or remove NA values before passing to validation functions.
# Validate and throw error if NA is present
assert_no_na(adsl$AGE, "Age variable contains NA values")

# Or filter NA values before validation
adsl_clean <- adsl[!is.na(adsl$AGE), ]
Advanced: ADaMData Wrapper
For population filtering and computed properties:
# Wrap ADaM data with automatic population filtering
adam_data <- ADaMData(
  data = adsl,
  domain = "ADSL",
  population = "SAF",
  trt_var = "TRT01A"
)

# Access filtered data and treatment counts directly
adam_data@filtered_data  # Auto-filtered to SAFFL == "Y"
adam_data@trt_n          # Treatment group N's computed automatically
Key Features
Efficacy Tables
# Time-to-event summary with median, HR, and landmarks
tte_table <- create_tte_summary_table(
  adtte,
  time_var = "AVAL",
  event_var = "CNSR",
  trt_var = "TRT01A",
  landmarks = c(6, 12)
)

# Responder analysis with CI, OR, RR, RD
responder_table <- create_responder_table(
  adrs,
  response_var = "AVALC",
  trt_var = "TRT01A",
  effect_measure = "OR"
)
Safety Tables
# AE Overview, by SOC, most common
create_ae_summary_table(adae, adsl, type = "overview")
create_ae_summary_table(adae, adsl, type = "soc")
create_ae_summary_table(adae, adsl, type = "common", n_top = 15)
Report Generation
# Build and export a complete report
report <- ClinicalReport(
  study_id = "STUDY-001",
  study_title = "Phase III Clinical Trial"
)

section <- ReportSection(title = "Efficacy Results", section_type = "efficacy")
section <- add_content(section, tte_table)
section <- add_content(section, km_plot)
report <- add_section(report, section)

generate_word(report, "study_report.docx")
G-BA Module 4 Compliance
# Create and validate G-BA compliant tables
module4_table <- create_hta_module4_table()
module4_table <- to_gba_template(module4_table)
check_gba_compliance(module4_table, strict = FALSE)
Meta-Analysis & Evidence Synthesis
# Random-effects meta-analysis
result <- meta_analysis(
  yi = log(c(0.75, 0.82, 0.68, 0.91, 0.77)),
  sei = c(0.12, 0.15, 0.18, 0.14, 0.11),
  study_labels = paste("Study", 1:5),
  effect_measure = "hr",
  model = "random"
)
result@estimate
result@heterogeneity$I2

# Forest plot
forest_plot <- create_meta_forest_plot(result, title = "Treatment Effect")
forest_plot@plot

# Network meta-analysis
nma_data <- data.frame(
  study = c("S1", "S2", "S3"),
  treat1 = c("A", "B", "A"),
  treat2 = c("B", "C", "C"),
  effect = log(c(0.75, 0.90, 0.80)),
  se = c(0.12, 0.15, 0.18)
)
nma_result <- network_meta(nma_data, effect_measure = "hr")
nma_result@comparisons
Classes
-
ADaMData- ADaM dataset wrapper with population filtering -
Endpoint/HTAEndpoint- Endpoint definitions for analyses -
Study- Base class withSingleArmStudy,TwoArmStudy,MultiArmStudy -
StudySet- Collection of studies for evidence synthesis -
ClinicalTable- Table with formatting -
ClinicalPlot- Plot with export settings -
ClinicalReport- Report with sections -
StudyResult- Container for single-study results -
StatResult- Statistical result base class (ComparisonResult,MetaResult) -
EvidenceGrade- IQWiG evidence grading result
Learn More
Browse the full documentation.