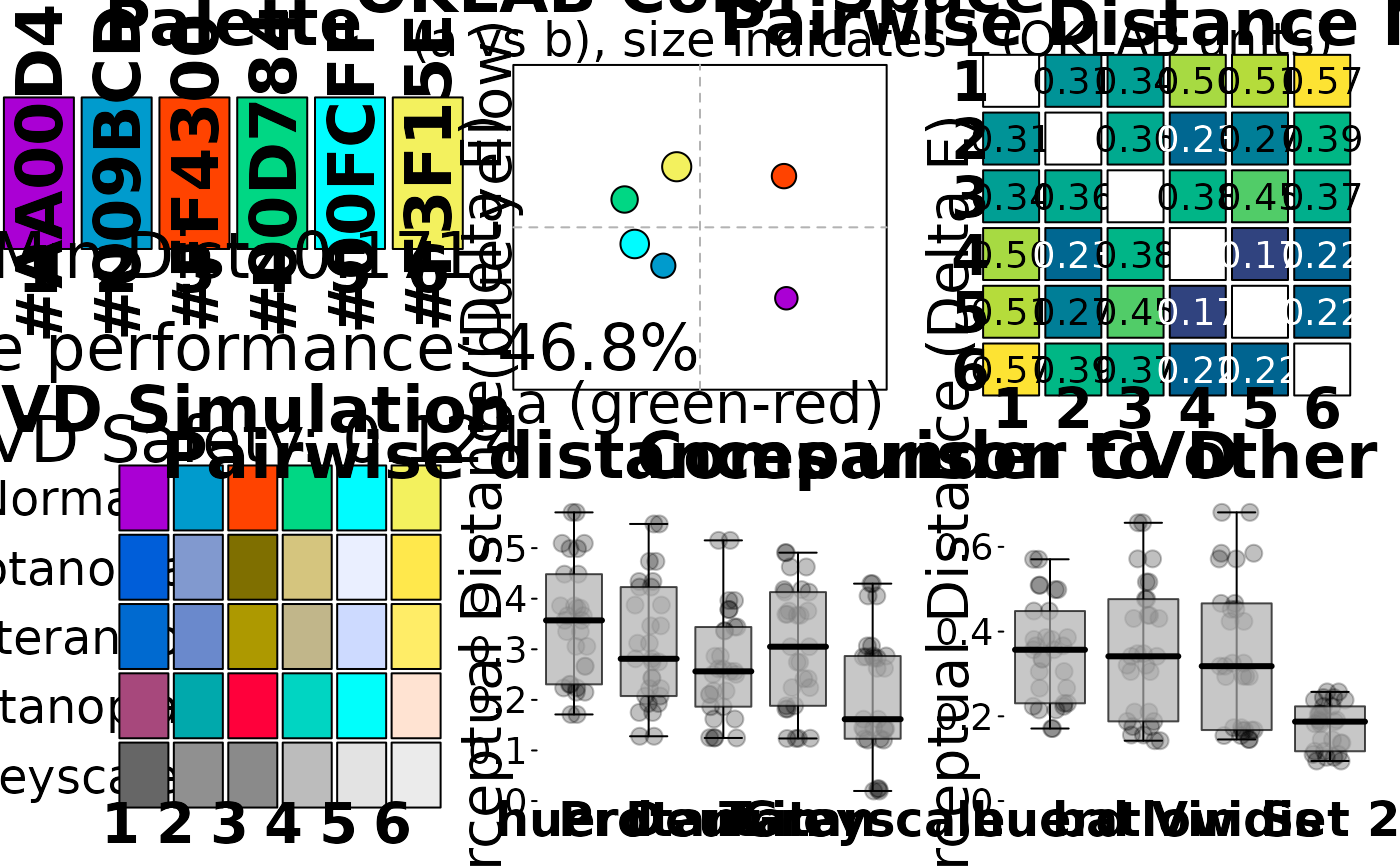
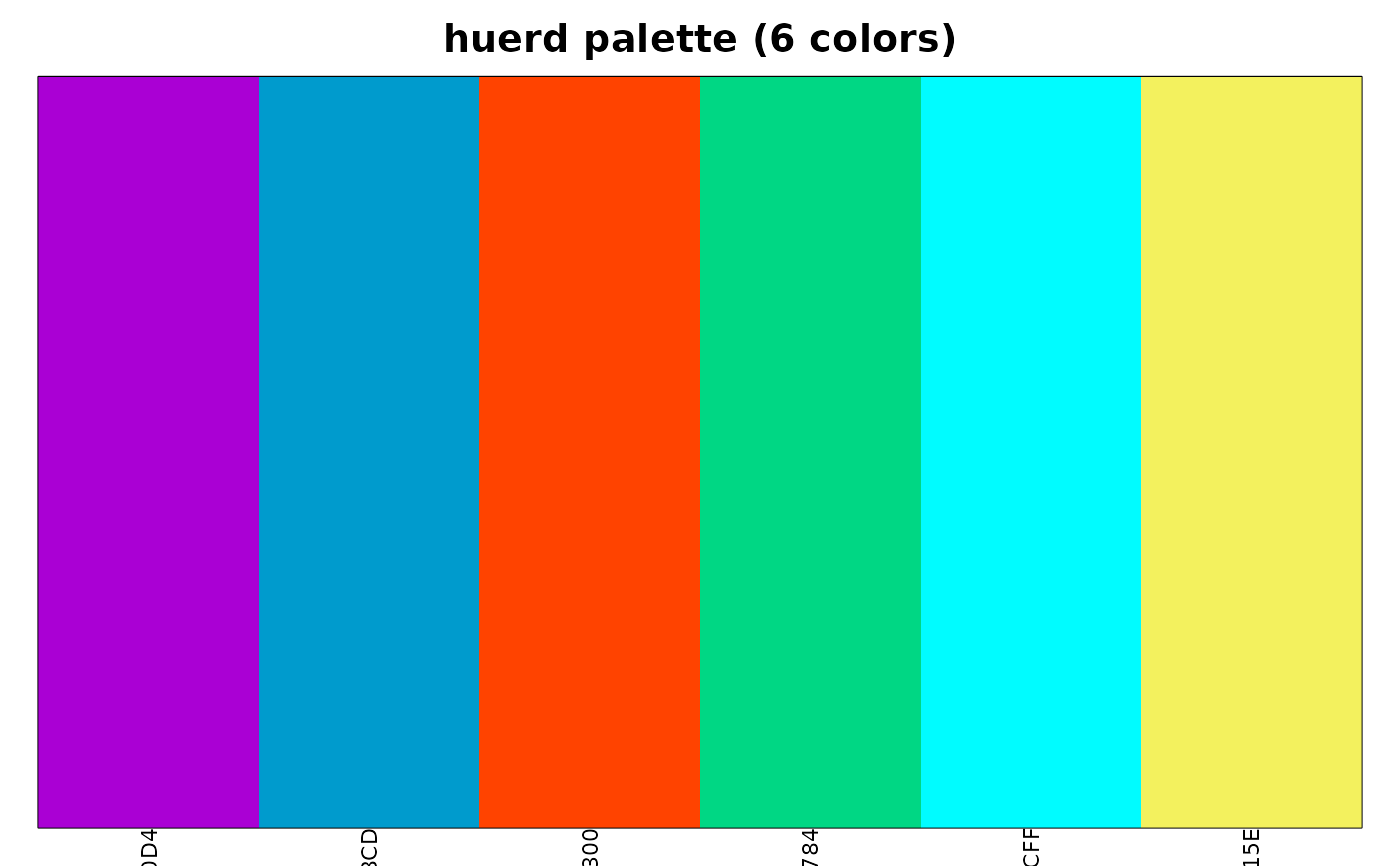
Display a visual representation of a huerd palette. By default shows color
swatches; use type = "analysis" for the full diagnostic dashboard.
Usage
# S3 method for class 'huerd_palette'
plot(x, type = c("swatches", "analysis"), ...)
Arguments
- x
A huerd_palette object.
- type
Type of plot: "swatches" for simple color display or
"analysis" for the full diagnostic dashboard.
- ...
Additional arguments passed to plotting functions.
Value
Invisibly returns the palette.
Examples
pal <- generate_palette(6, progress = FALSE)

# Simple swatch display
plot(pal)


# Full analysis dashboard
plot(pal, type = "analysis")
# Full analysis dashboard
plot(pal, type = "analysis")