Comprehensive Palette Analysis Dashboard
Source:R/visualization_analysis.R
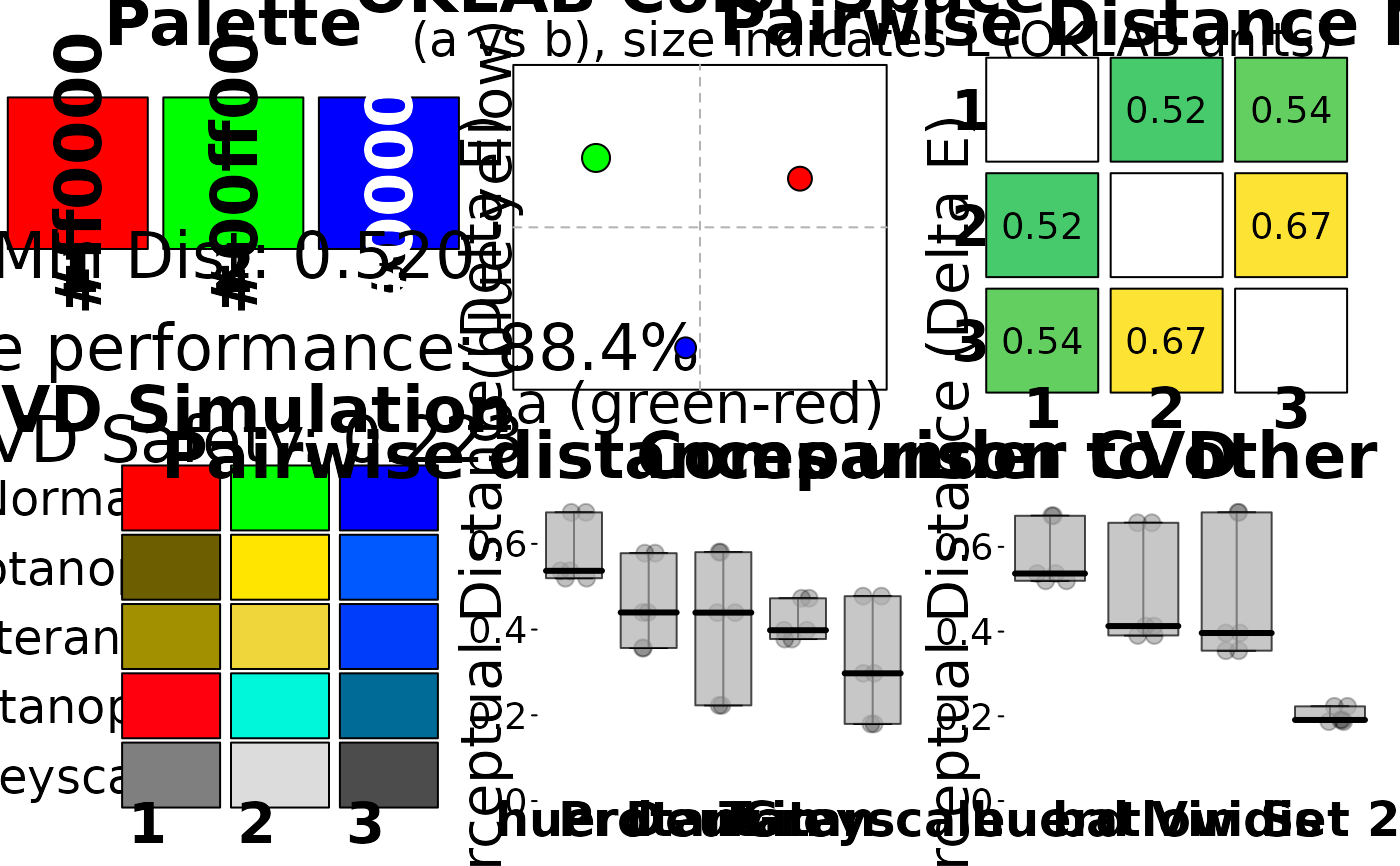
plot_palette_analysis.RdCreates a scicomap-inspired comprehensive diagnostic dashboard for color palettes using the modern grid graphics system for robust cross-platform compatibility. This function generates six visualization panels to help assess palette quality, including perceptual distance analysis, CVD simulation, OKLAB space distribution, and performance comparison against established scientific palettes.
Examples
colors <- c("#ff0000", "#00ff00", "#0000ff")
plot_palette_analysis(colors)